
Interactive database allowing organizations to calculate their carbon emissions for both existing and hypothetical locations.
.avif)
WM’s corporate clients face increasing pressure to calculate, disclose, and reduce their annual greenhouse emissions.
While WM was able to use historical data to provide accurate CO2 summaries based on waste generated at existing locations, customers were unable to predict how hypothetical changes in their waste output might affect their total emissions.
Working in lockstep, representatives from WM’s Business, Design, and Development teams each contributed a unique set of skills.

The Business Team’s Product Owner was responsible for both the product’s launch as well as managing relationships with WM’s internal stakeholders.

The Development Team consisted of eight software architects and QA engineers. The team was supervised by an Engineering Manager.

As the Principal within the Design Team, I managed all aspects of the proposed user experience. This included UX research, UI design, and product testing.
The Business, Design, and Development teams were already collaborating on various digital sustainability projects. For new digital tools, we followed the Scrum methodology, using three-week sprints.
The need to calculate emissions data was frequently requested by WM customers. However, the scope of the issue and the specific pain points were not defined. We established our parameters for research, design, and testing before considering potential solutions.
.avif)
Conversations with My Impact’s customers illustrated the potential value of a tradeoff calculator. However, information including the problem’s scope, expected client value, and anticipated metrics remained undefined.
WM stakeholder interviews were conducted by a UX Researcher in a 1:1 setting. Important sections of these interviews were shared with the Business and Development teams to ensure all contributors had a clear understanding of the stakeholder’s perspective.
We focused on three specific exercises:
.avif)
As three separate individuals were responsible for conducting user interviews, it was paramount to ensure uniformity with the collection, organization, tagging of our qualitative data.
After the first set of interviews, UX Researchers regrouped to develop a system of affinities for tagging all feedback.
This attention to detail ensured our data organization was uniform while preserving our ability for all UX researchers to search and classify the data.
.gif)
Our team collected 840 individual data points from the initial stakeholder interviews.
After multiple iterations, the team also finalized a set of 25 affinities that were reused for the life of the project.
.avif)
%201.avif)
Customer-specific solution example. The Data Science team built an Excel -based macro allowing a customer to adjust their materials and emissions data.
Although WM has access to the necessary data that to calculate location-based emissions, WM does not have a digital hub available to share this data. Instead, the customer needs to request this data (typically delivered in an Excel spreadsheet).
Additionally, most of these calculations are static. If a customer wants to propose changes to their waste stream, they need to request this information from their WM account team.
Although customers are able to submit requests, each customer has a unique set of parameters.
For example, some want to view the impact of converting their hauling from diesel to electric, while others want to understand how a reduction in emissions could affect their annual expenses.
After conducting stakeholder interviews, we created a journey map to visualize the numerous internal steps required to address what the customer considers to be a straightforward data request.

Although our research showed that the overall issue was nuanced, crafting a brief problem statement allowed us to introduce the current customer landscape to WM management before discussing potential next steps.
To ensure alignment with management, the Design Team developed a matrix to illustrate how the the problem statement impacted both WM account holders and customers.

Following reviews with all project teams as well as WM management, we aligned on the following description and problem statement.
.avif)
Alignment with Account Teams. Describing the specific pain points allowed account teams to view the problem statement from the lens of customer retention.
.avif)
One size does not fit all. Our statement emphasized how the lack of an automated solution created a complex workflow requiring extra effort from multiple teams.
With this Comparison Calculator, we aimed to create a streamlined digital workflow that reduced the need for customers to submit complex data requests. Given the complexity of this task, we conducted an as-is/to-be analysis to identify potential gaps in our approach.
As a first step, we mapped various customer scenarios to compare the current process with our proposed improvements.

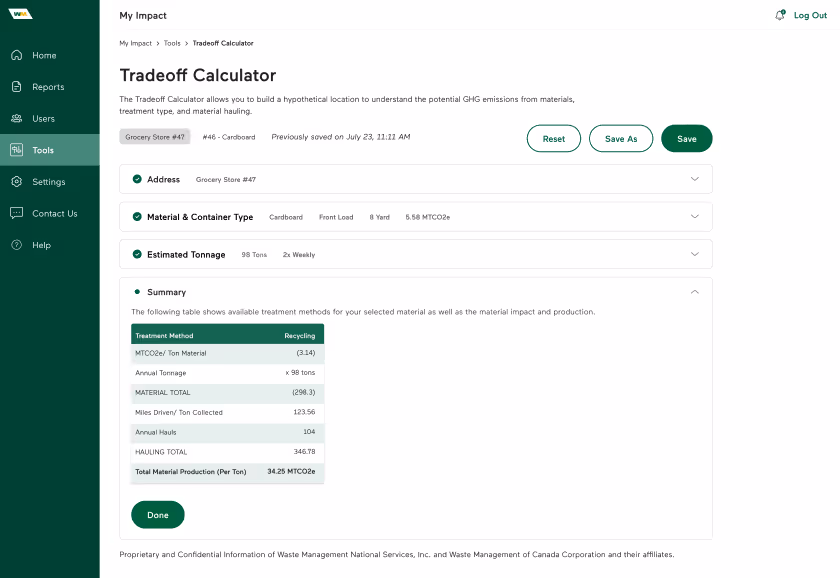
Situation: When using the Tradeoff Calculator, users need to make selections in each of the following categories:
Problem: At most organizations, these decisions are made by a member of the procurement or facilities team. However, the Tradeoff Calculator will most likely be used by members of the sustainability or environmental teams.
Unlike members of procurement teams, sustainability team members are often unaware their organization has control over how their waste is hauled, treated, and disposed.
Solution: Infographics were added at key points of the user journey to describe the container, hauling, and treatment methods. This ensured all users had a better understanding of the options available for potential greenhouse reductions.
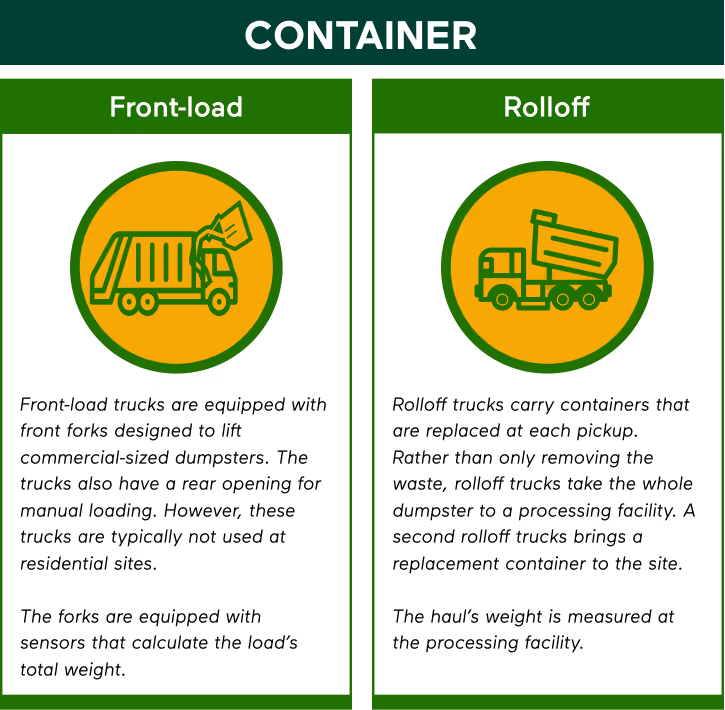


Intro to Waste Metrics. In order to calculate greenhouse emissions, customers need to select container type, treatment method, and hauling fuel.
Situation: Payments to WM are often fragmented. Although the customer’s corporate teams is typically responsible for negotiating prices with WM, individual locations are responsible for paying the actual bill.
Problem: If a customer site uses the Tradeoff Calculator and finds opportunities for emission reductions, both the customer’s management team and the WM account holder would be unaware of the opportunity.
The misalignment creates missed opportunities for WM-side business development and client-side carbon reduction.
Solution: Users are able to save analyses for specific locations. Any saved searches are visible for other users within the same organization. This ensures customers have the ability to discuss proposed changes with WM account holders.
.gif)
Dissecting our key problem areas illustrated the various nuances of the expected deliverable. However, even with a strong understanding of expectations, the information architecture proved challenging.
Before prototyping, we regrouped with the dev team to share progress, review functionality, and discuss a development timeline.
To facilitate conversations, we created an updated user journey by integrating the updated metrics that surfaced during Problem Validation.

We specifically focused on the information architecture ensure users made informed decisions.
Previous research revealed that users often felt overwhelmed by unfamiliar waste and hauling terminology. As such, we ensured any selections were accompanied by additional context.

To kickoff the Design Phase, we revisited the Problem Identification Phase to consider potential solutions.


As we neared completion of our initial design, our team scheduled multiple rounds of user testing with diverse stakeholders. These sessions provided continuous feedback and supported rapid iteration of our prototype.
To ensure the Tradeoff Calculator met the needs of various users, we conducted product testing diverse groups of internal and external stakeholders.
UX Researchers provided a steady stream of user feedback.
Key findings were presented to UX Designers who continued to improve the product’s UI.
Updated wireframes were shared with UX Researchers for continued testing.


We shared wireframes and prototypes with both existing customers and new customers unfamiliar with the product. This approach allowed us to gather insights from individuals without existing biases.

Prototypes were also introduced during meetings with internal WM account and sales teams.
Several design enhancements were made as the product underwent UI refinement, followed by a final visual review by WM’s Branding Team.
In a phased approach, UX Researchers employed various types of user testing, tailored to the fidelity of the current design.

The development process advanced from wireframes to prototypes, and ultimately to a beta environment that integrated directly with WM’s databases.
The following case studies illustrate the development of two features: 1) task progression and 2) data organization.

Initial designs included a linear progress bar with defined steps. However, users stated that the individual steps did not accurately reflect the level of effort.
Specifically, users were easily able to select a material type in the first step; however, step two (entering tonnage) involved additional analysis that had to be completed before a number could be entered.

Based on feedback and the need to incorporate different waste disposal types, we developed a compartmentalized design. This allowed users to revisit previous steps, review their selections, and make edits.
While users found the vertical steps easier to navigate, they indicated a need to frequently switch between steps to retrieve previously entered data or make changes based on calculation results.

Text labels containing information about a user’s selections were added to the individual dropdown frames.
This improvement allowed users to reference their previous entries without navigating to completed sections.

In the initial design, users followed steps to input their data. Results were then displayed in real time.
However, this process confused most users. Specifically, as each material requires a unique entry, the workflow felt disjointed and resulted in misalignment between inputs and expected results.


To provide consistency, we redesigned the workflow to illustrate the results after each unique step.
Additionally, materials were calculated individually, thus allowing users to complete the workflow before selecting a different material for comparison.
Our team completed supplementary tasks designed to improve the overall efficiency of our development process.

In addition to its home on My Impact, WM integrated the Tradeoff Calculator into each customer’s account landing page. This broader placement enables clients to use the tool while managing services at specific locations. This also improved communication between customers and their account teams.

Working closely with the Dev Team, Adobe Analytics was integrated into the platform. This addition allowed the WM UX Team to track usage statistics for organizations as well as individual users.
Beyond logins, we were able to track statistics for selected materials as well as the preferred hauling type and treatment types. This data can be downloaded and shared with WM’s Corporate Customer Team.

Although WM has a design system for their website, My Impact was WM’s first web-based tool providing customers with an interactive view of their data. As such, our work required supplementary components.
As My Impact included a diverse set of contributors focused on multiple features, it was important for the design system to be consistent, efficient, and scalable.


.gif)